Pump head pressure is easiest to understand as the energy a pump adds to a fluid at its discharge side. Once you see how head, pressure, flow, and system resistance fit together, it becomes much easier to size equipment, spot a bad reading, and avoid the usual mistakes that waste power or shorten pump life. I will keep the focus on practical fluid power issues: what the outlet reading really means, how to read the pump curve, and what to check when the system behaves differently from the datasheet.
The essentials in one glance
- Head is an energy measure; pressure is the force reading you see on the discharge side.
- For water, 1 metre of head is about 9.81 kPa, or roughly 0.098 bar.
- A pump’s working point is set by the intersection of the pump curve and the system curve.
- Unexpected discharge pressure usually comes from valves, speed, air ingress, wear, fouling, or suction problems.
- Positive displacement pumps behave differently from centrifugal pumps and need pressure protection.
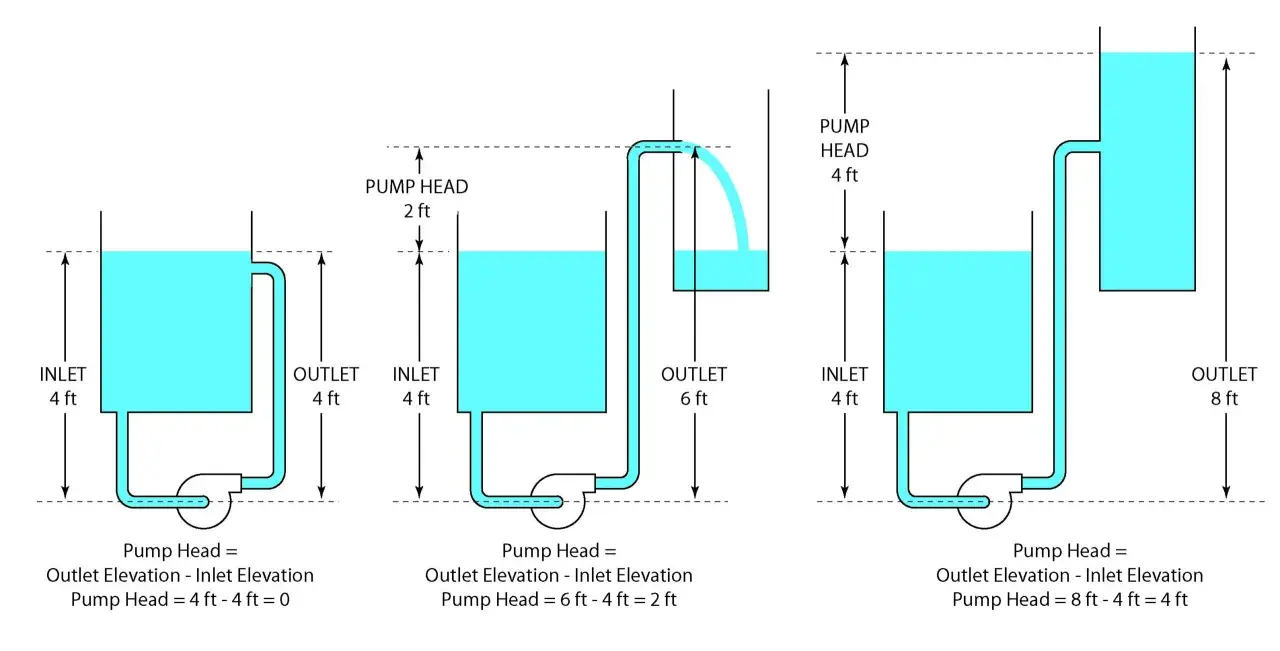
What pump head really measures
In fluid power terms, head is the amount of energy per unit weight that the pump adds to the liquid. Pressure is the force per unit area at the outlet. The two are linked by p = ρgh, which means the same head produces different pressure depending on the fluid density.
That distinction matters more than many operators expect. A duty point of 30 m head is about 294 kPa, or just under 3 bar, for water. The same head on a lighter liquid produces less discharge pressure, while a denser liquid produces more. If the liquid is not water, you cannot assume the gauge reading will match the head figure on the curve without checking specific gravity.
| Concept | What it tells you | Why it matters |
|---|---|---|
| Head | How much hydraulic energy the pump adds | Lets you compare performance across systems |
| Pressure | The force reading at the outlet | Shows what the process and instruments actually see |
| Differential pressure | Outlet pressure minus inlet pressure | Represents the pump’s contribution across the machine |
| Total dynamic head | Static lift, friction losses, minor losses, and process pressure | The realistic basis for sizing and selection |
For UK plant rooms, I find it simplest to think in metres and bar together: metres describe what the pump is doing hydraulically, while bar shows what the pipework or process sees. That makes the next step much clearer, because a pump does not work in isolation; it works against a curve.
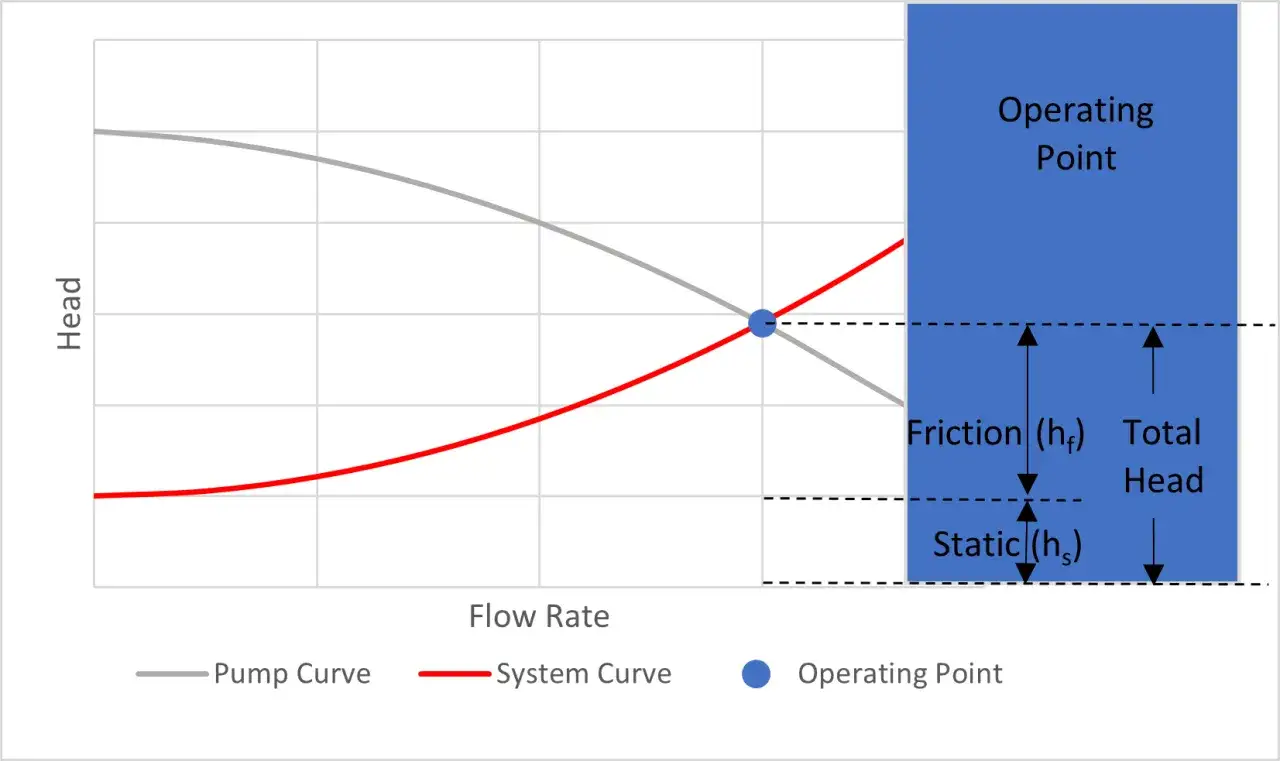
How to read a pump curve without guessing
A pump curve shows how much head a pump can produce at different flow rates. On a centrifugal pump, head usually falls as flow rises, so the duty point is never just a single nameplate number. The operating point sits where the pump curve meets the system curve, and that intersection changes whenever pipe losses, valve position, or speed change.
The best efficiency point, or BEP, is the part of the curve where the pump usually runs most comfortably. Too far left and you risk recirculation and heat; too far right and you often pay for extra flow with lower efficiency and more stress. I treat BEP as a practical target, not a marketing term. It is where the pump, the motor, and the pipework tend to behave most predictably.
| Pump type | How discharge pressure behaves | What sets the limit | Why that matters |
|---|---|---|---|
| Centrifugal | Head changes with flow; pressure follows the system curve | Speed, impeller diameter, friction losses | Best for variable flow and broad industrial services |
| Positive displacement | Delivers near-fixed volume per revolution; pressure rises until resistance limits it | Relief valve, motor limit, pipe resistance | Needs pressure protection because deadheading is dangerous |
Why discharge pressure drifts in real systems
When the gauge moves away from expectation, I work from the easiest causes outward. Many bad readings are not pump failures at all; they are system changes. A partially closed valve, a dirty strainer, or a control setpoint that has drifted can make a healthy pump look weak or over-pressurised.
One trap I see often is blaming the pump when the real issue is on the suction side. If the inlet is starved, the discharge reading often becomes unstable long before the pump stops completely. Cavitation, air ingress, and low net positive suction head all show up as noise, vibration, and erratic pressure long before they show up as a full shutdown.| Likely cause | What the pressure does | What to check first |
|---|---|---|
| Downstream valve throttling | Pressure rises, flow falls | Control valve position, manual isolation valves |
| Clogged strainer or filter | Pressure rises upstream of the restriction | Differential pressure across the filter, service records |
| Air ingress or poor priming | Pressure fluctuates or drops sharply | Suction seals, venting, pump casing fill |
| Impeller wear or erosion | Pressure falls at the same speed | Wear rings, impeller clearance, corrosion |
| Wrong rotation or low speed | Pressure is below the expected curve | Motor wiring, VFD settings, rotation arrow |
| Cavitation | Pressure becomes unstable and noisy | Suction losses, liquid temperature, NPSH margin |
| Viscosity or temperature shift | Curve shifts; power draw changes | Process conditions, fluid properties, duty point |
If the outlet reading changed after a process change, I usually suspect the system first. If it changed after a service event, I look at rotation, priming, and valve positions first. That sequence saves a lot of time and avoids replacing good equipment for the wrong reason.
How I would size the outlet pressure for a new installation
When I size a pump, I start with the network, not the nameplate. The real question is what pressure the process needs at the point of use, then how much head the pipework consumes before the fluid gets there. That means adding static lift, friction losses, minor losses from bends and fittings, and any required process pressure into one duty point.
- Define the required flow and the minimum pressure at the point of use.
- Add static lift, friction losses, and minor losses for the pipework.
- Convert that demand into head for the actual fluid using its specific gravity.
- Check the pump curve at the expected flow and look for an operating point near the BEP.
- Add margin carefully. Do not oversize just to be safe, because excess head usually becomes wasted energy.
- Verify both low-demand and peak-demand cases before you commit to the design.
A quick example makes the sizing logic more tangible. If a process needs 2.4 bar at the outlet, plus 8 m of static lift and 5 m of friction loss, the water duty comes out at roughly 37.5 m head. At 0.02 m³/s, the ideal hydraulic power is about 7.3 kW before efficiency losses; at 70% efficiency, motor input rises to around 10.4 kW. That is why I treat head as an energy problem, not just a pressure number.
On a centrifugal pump, speed changes are powerful because flow follows speed, head follows the square of speed, and power follows the cube. A VFD is often a better answer than throttling, but only if the control loop is tuned properly and the sensor sits in the right place.
What smart monitoring adds on a modern plant floor
In 2026, the strongest installations I see are not relying on a single gauge. They combine discharge pressure, flow, motor current, and vibration so the control system can tell the difference between a real process change and a slowly failing pump. A pressure trend that drifts over days often matters more than a single snapshot, because wear, fouling, and valve creep show up gradually.
I also like sensor data because it turns vague complaints into specific actions. If pressure rises while flow falls, the system is usually getting tighter. If pressure falls while current and vibration rise, the pump is often operating outside its comfortable zone. If the numbers move together in a way that does not match the curve, the problem may be instrumentation rather than hydraulics.
- Pressure transmitter - confirms the actual outlet condition and feeds the VFD or PLC.
- Flow meter - shows whether a pressure change comes from demand or restriction.
- Motor current - gives an early clue about loading and mechanical drag.
- Vibration or temperature - helps catch cavitation, bearing wear, or misalignment before the pressure reading collapses.
The point of adding data is not to drown operators in alarms. It is to make the hydraulic state visible enough that you can act before energy waste turns into downtime. That is where industrial automation and fluid power meet in a practical way.
A quick field check before you trust the reading
- Confirm the units on the gauge or transmitter, especially if the system mixes bar, kPa, and metres.
- Compare the reading with the pump curve at the actual flow, not just at zero flow or nameplate speed.
- Check suction conditions, valve position, and strainers before deciding the pump is failing.
- Ask whether the fluid density or temperature has changed since commissioning.
If those checks still do not explain the number, the problem is usually in the system boundary rather than the pump itself. That is the fastest way I know to separate a control issue, a process change, and genuine hydraulic wear.