Sonic choking changes the maths immediately: once the flow reaches Mach 1 at the narrowest section, lowering downstream pressure no longer increases throughput in the normal way. In this article I show how to recognise the limit, how to calculate it for gases, why liquids behave differently, and where fluid power designs still get caught by the same few assumptions. A reliable choke flow calculation starts with the fluid state, not the valve catalogue.
The key points at a glance
- For gases, choking starts when the downstream-to-upstream absolute pressure ratio falls below a critical value set by the gas properties.
- Once the throat goes sonic, extra downstream pressure drop does not buy you more mass flow.
- Liquids usually hit cavitation or flashing limits before a true sonic limit becomes the main issue.
- Use absolute pressure, not gauge pressure, and keep temperature in kelvin.
- In UK projects, SI units such as bar(a), kPa, kg/h, and m3/h keep the sizing consistent.
- If the result affects a control valve, regulator, or safety device, vendor sizing data is safer than a hand calculation alone.
What choked flow means in fluid power
In practice, I treat choked flow as the point where the restriction stops responding to downstream pressure in the way most people expect. For a compressible fluid, the narrowest point reaches sonic velocity, so pressure waves can no longer travel upstream through that throat to increase the mass flow further.
That is why the effect shows up so often in pneumatic systems, nozzle tests, pilot lines, quick exhaust valves, and small orifices. It is less about the absolute line speed and more about the local condition at the restriction. In hydraulics, the common limit is usually different: the liquid tends to run into cavitation, flashing, or pressure-recovery problems before a true sonic limit becomes the main design constraint.I also like to separate the physics from the hardware. The same phenomenon can appear in a nozzle, a sharp-edged orifice, a valve trim, or a relief passage, but the details of the coefficient and the geometry change the answer. Once you see that boundary, the gas equation becomes much easier to use.
How I calculate choked flow in gases
For gases, I start with the pressure ratio. If the downstream absolute pressure is low enough, the flow becomes choked and the mass flow is fixed by upstream conditions, gas properties, temperature, and effective area.
Check the critical pressure ratio first
The basic ideal-gas condition is:
P2 / P1 ≤ (2 / (k + 1))k / (k - 1)
Here, k is the ratio of specific heats. For air, k is about 1.4, so the critical ratio is roughly 0.528. In plain terms, if the upstream pressure is 8 bar(a), choking starts once the downstream pressure falls below about 4.22 bar(a).
Use the mass-flow equation at the throat
Once the sonic limit is reached, the limiting mass flow can be estimated with:
Mass flow rate = Cd × A × P0 × sqrt(k / (R × T0)) × (2 / (k + 1))(k + 1) / (2(k - 1))
Where:
| Symbol | Meaning | Why it matters |
|---|---|---|
| Cd | Discharge coefficient | Captures losses from the real geometry |
| A | Flow area | The effective throat area, not the pipe area |
| P0 | Upstream absolute pressure | Use absolute, not gauge pressure |
| T0 | Upstream absolute temperature | Must be in kelvin |
| R | Specific gas constant | Depends on gas composition |
| k | Specific heat ratio | Changes the critical ratio and capacity |
For a control valve, I would not force this equation onto the hardware if vendor sizing data is available. The physics is the same, but the effective area and recovery behaviour are packaged differently in Cv, Kv, or other manufacturer coefficients.
Read Also: Velocity Pressure Formula - Master Fluid Dynamics Now
A quick air example
Take air at 8 bar(a) and 20°C with k = 1.4, a 3 mm orifice, and Cd = 0.9. The critical downstream pressure is about 4.22 bar(a), so the restriction is already choked if the outlet is below that value. Using the equation above, the limiting flow comes out at roughly 0.012 kg/s, or about 43 kg/h.
That is also about 4.6 m3/h at line conditions, which is a good reminder that volumetric flow can be misleading when density is changing. In pneumatics, mass flow is the safer number to keep in mind.
That gas logic is clean enough once the pressure ratio is clear, but liquids need a different way of thinking, which is where many sizing mistakes begin.
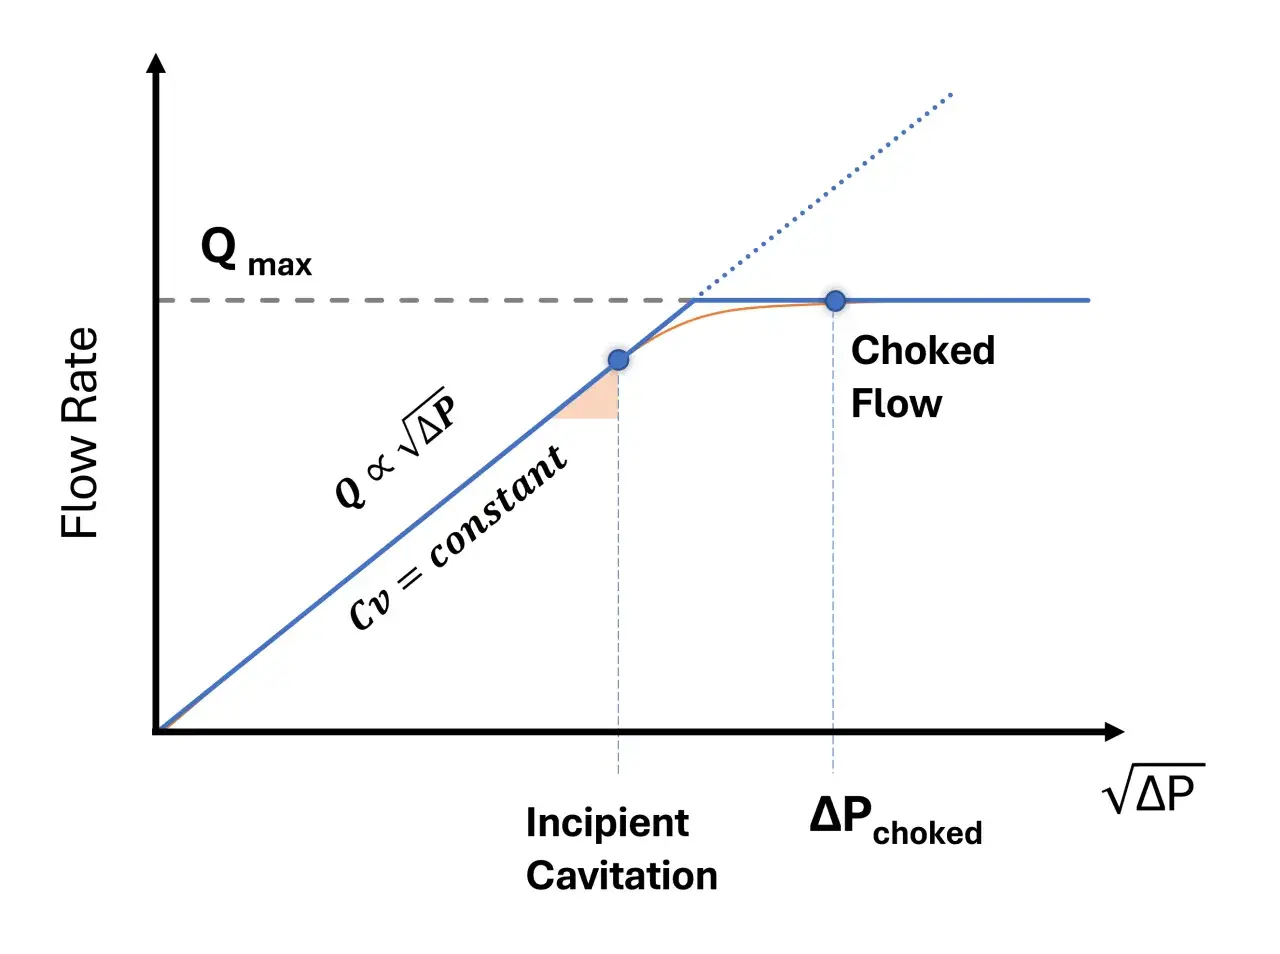
Why liquids are different
Liquids do not behave like ideal gases, so I do not use the sonic-gas rule as a shortcut for hydraulic oil or water service. In liquid valve sizing, the practical limit is usually tied to pressure recovery and vapour pressure. If the local pressure inside the restriction falls too far, the liquid starts to vaporise, and the system can become flow-limited even if the downstream pressure keeps dropping.
A useful engineering form for the pressure-drop limit is:
ΔPmax = FL2 × (P1 - FF × Pv)
Here, P1 is upstream absolute pressure, Pv is the liquid vapour pressure at inlet temperature, FL is the recovery factor, and FF is the liquid critical pressure ratio factor. If the actual service pressure drop is higher than ΔPmax, the valve is in choked-flow conditions and the larger pressure drop no longer increases capacity.
| Condition | What causes it | What you usually notice |
|---|---|---|
| Gas choking | Flow reaches sonic velocity at the throat | Mass flow stops rising with more downstream drop |
| Cavitation | Local pressure falls below vapour pressure, then recovers | Noise, vibration, trim damage, unstable control |
| Flashing | Outlet pressure stays below vapour pressure | Persistent two-phase outlet and density loss |
The distinction matters because cavitation and flashing are not just naming differences. Cavitation can destroy trim surprisingly quickly, while flashing changes the downstream mixture and makes control less predictable. Once that boundary is clear, the usual errors are easier to spot.
The mistakes that distort the answer fastest
- Using gauge pressure instead of absolute pressure. That is the fastest way to ruin a gas calculation, especially at modest supply pressures.
- Leaving temperature in °C. The gas equation needs kelvin, and the error gets ugly if someone drops the conversion.
- Mixing standard volume flow with line flow. A normalised flow rate is useful, but only if you know which density basis it assumes.
- Applying the gas formula to hydraulic liquids. Liquids fail by a different mechanism, so the result can look neat and still be wrong.
- Ignoring fittings and pressure recovery. Reducers, elbows, and valve geometry change the effective limit more than many worksheets admit.
- Assuming more downstream pressure drop always means more capacity. Once the restriction is choked, the control lever has already run out.
My rule here is simple: if the calculation depends on a quiet set of assumptions, I write those assumptions next to the result. That makes it much easier to see when the model no longer matches the hardware.
When a hand calculation is no longer enough
I stop trusting a back-of-envelope method when the problem starts to look like a real operating risk rather than a sizing exercise. That happens fast if the service is two-phase, if the fluid is close to boiling, if viscosity is high enough to push the Reynolds correction into the result, or if several fittings sit immediately upstream and downstream of the restriction.
I also become cautious when the flow is part of a safety function. Relief valves, blowdown lines, and high-energy pneumatic exhausts deserve more than a neat formula on a worksheet. At that point I want vendor sizing software, validated test data, or CFD if the geometry is unusual.
In a modern automated plant, this is where instrumentation earns its keep. A pressure transmitter, flow meter, or even a simple trend in the control system can tell you whether the line is actually living near the sonic limit or whether the model has drifted away from reality. That practical feedback is often worth more than another round of algebra.Once the result has to survive commissioning, I treat the calculation as a starting point, not the final word.
The checks I make before signing off a sonic-flow result
- I confirm that every pressure in the gas calculation is absolute.
- I check that the fluid is really single-phase and really the fluid I modelled.
- I verify the temperature basis, especially when the gas is warm, cooled, or compressed upstream.
- I compare the geometry against the assumed area, discharge coefficient, or vendor Cv/Kv data.
- I account for reducers, elbows, regulators, and any other fittings that change recovery.
- I ask whether the result is being used for control, for protection, or only for rough sizing, because the confidence level should match the decision.
If the design is near its limit, I prefer to leave some practical margin and to validate the installation with real pressure data after commissioning. That is usually enough to move from a reasonable estimate to a result I would trust in the field.