Compressible flow behaves differently from liquid flow once the pressure drop gets large enough, and that is where valve sizing and pneumatic performance start to diverge. The critical flow factor is one of the numbers engineers use to describe that boundary: it tells you how a component recovers pressure, when flow chokes, and why the same valve can behave very differently at different operating points. In practice, it matters any time you are trying to protect a process from cavitation, noise, unstable control, or unexpected loss of capacity.
What matters most before you size the valve
- FL is the liquid-side pressure recovery factor; lower values generally mean more pressure recovery after the vena contracta.
- For gases, the useful threshold is usually the critical pressure ratio b, not FL alone.
- Once flow is choked, downstream pressure stops being the main driver of mass flow.
- Cv and Kv tell you capacity, but not the whole flow story.
- ISO 6358 remains the reference family for pneumatic flow-rate testing in 2026.
How the factor behaves in liquid and gas service
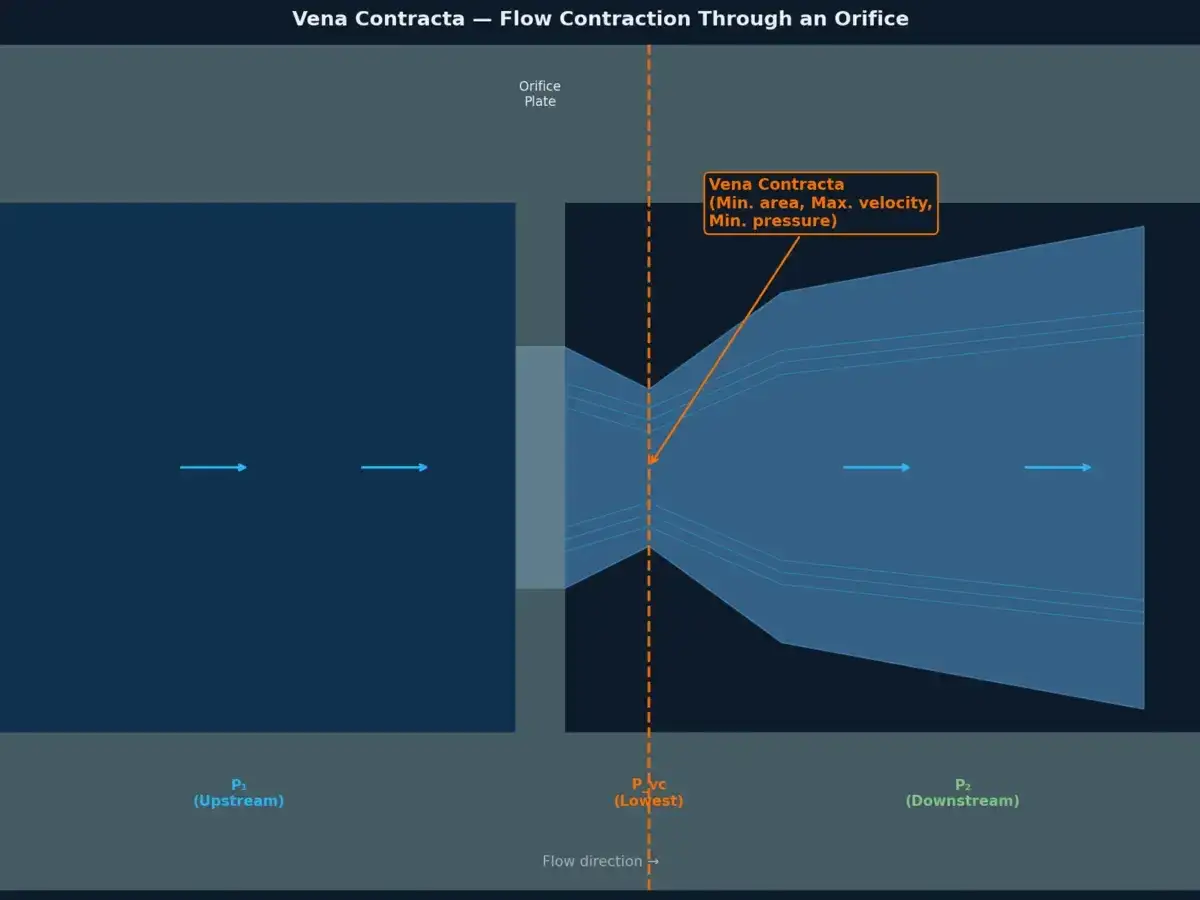
The term is dimensionless, but it is not a broad similarity number like Reynolds or Mach. In valve work, it is a component coefficient, which is why I treat it as a sizing aid rather than a universal law. In liquid service, it is usually read as FL, the pressure-recovery factor. It compares inlet pressure with the pressure at the vena contracta, the narrowest point in the stream where velocity peaks and pressure is lowest.
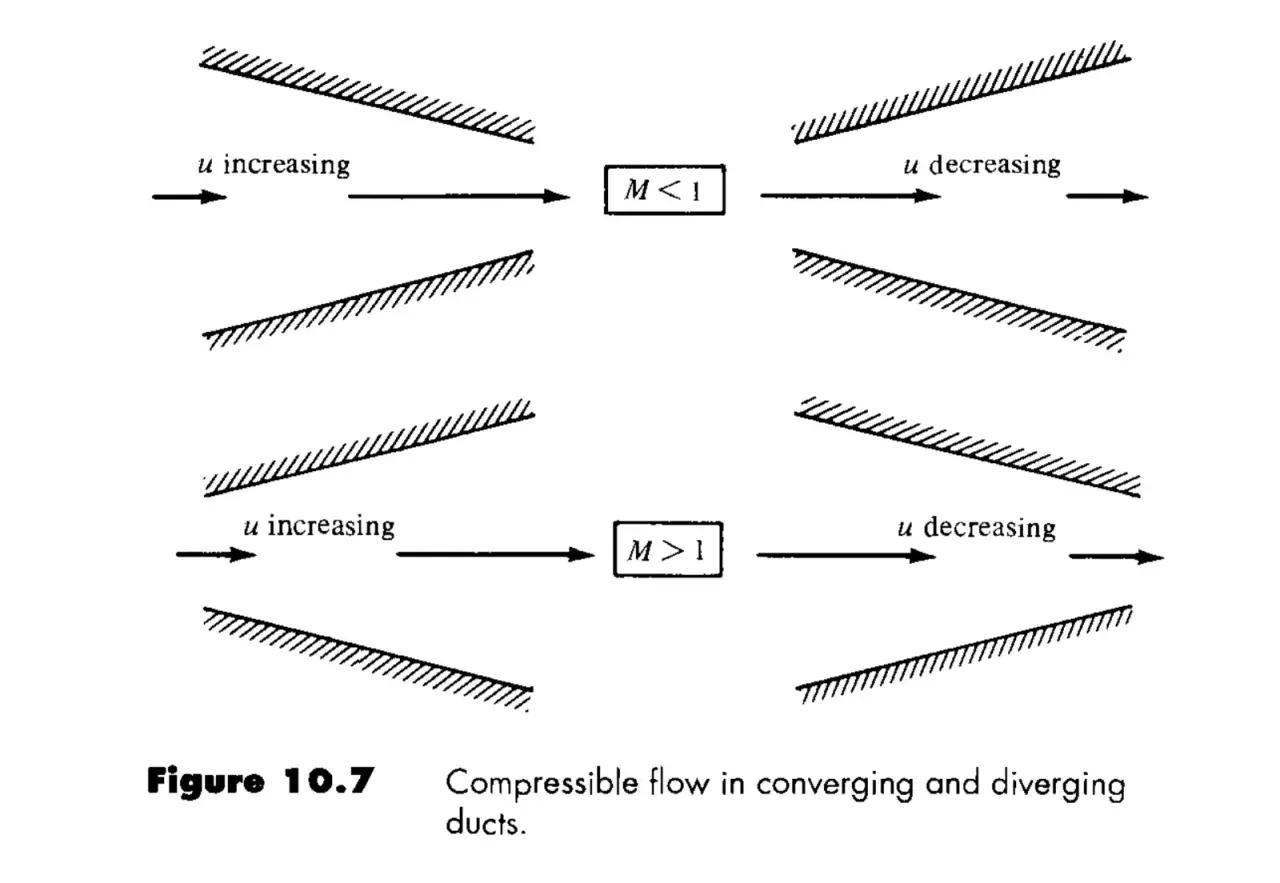
A lower FL usually means the valve recovers more pressure before the outlet, which is exactly where cavitation risk starts to rise. That matters because once the local pressure at the vena contracta drops too far, you can get bubble formation, collapse, noise, trim damage, and poor controllability. In gas service, the same idea shows up differently. Pneumatic sizing standards such as ISO 6358 focus on sonic conductance C and the critical pressure ratio b. Once the downstream-to-upstream ratio falls below b, the flow becomes choked, and mass flow stops responding strongly to further downstream pressure drops.
That split is important. A liquid valve can be limited by pressure recovery and cavitation, while a gas valve or orifice can be limited by sonic velocity in the throat. If you size the component without first identifying which regime dominates, the number will look precise and still lead you in the wrong direction.
Why it changes valve behaviour in real plants
This is not an academic label. In liquid loops, FL helps predict how hard the valve is working near the vena contracta and whether the process is drifting toward cavitation or flashing. In gas, steam, and instrument air lines, the same boundary explains why capacity can flatten out even when you keep pushing the downstream pressure lower. The valve is no longer behaving like a simple restriction; it is running into a flow condition limit.
What that looks like on the plant floor is usually easy to recognise once you know what to listen for:
- Rising noise often means the system is near or inside a critical flow region.
- Vibration or trim wear usually points to repeated cavitation or unstable recovery.
- Poor loop response can happen when the valve is oversized for one regime and undersized for another.
- Slower actuator performance may reflect back-pressure or a flow path that is more restrictive than the datasheet suggests.
In a modern UK plant, I would not separate this from instrumentation. If pressure transmitters, valve-position feedback, and flow signals are already going into a historian, the useful question is not just what the catalogue says. It is whether the live pressure ratio stays where the model expects it to stay. That is where smart manufacturing tools start paying for themselves.
How I map it against Cv, Kv, C and b
This is where confusion usually creeps in, because the catalogue language is inconsistent across fluids and standards. I prefer to separate the terms before I size anything. The table below is the version I keep in my head when I am checking a valve, regulator, or pneumatic component.
| Term | What it tells you | Best use | What it will not tell you |
|---|---|---|---|
| FL | How much pressure is recovered between the vena contracta and the outlet | Liquid control valves and cavitation checks | Actual flow capacity by itself |
| Cv / Kv | Flow capacity at a stated pressure drop | General valve sizing for liquids and, with the right equations, some gases | Whether the component will choke or cavitate |
| C sonic conductance | How easily a pneumatic component passes gas in choked and subsonic flow | Pneumatic fluid power components tested to ISO 6358 | Liquid pressure recovery behaviour |
| b critical pressure ratio | The downstream-to-upstream ratio at which gas flow becomes choked | Compressed air, gas valves, solenoids, and air preparation components | Liquid cavitation margin |
| S effective area | An equivalent throat area for pneumatic flow comparison | Alternative representation of compressible flow capacity | The full dynamic behaviour of a real valve train |
ISO 6358-1 and ISO 6358-2 remain the practical reference points for pneumatic flow-rate testing, and the family is still current in 2026. The standard framework also matters because it does not pretend every component behaves the same way: it excludes unstable flow coefficients, strong hysteresis, internal feedback devices such as regulators, cracking-pressure devices such as check valves and quick-exhaust valves, and energy-exchanging components such as cylinders and accumulators. That limitation is useful, because it reminds you not to force one coefficient onto every part in the circuit.
For pneumatics, I also pay attention to the reference conditions. ISO-style test data are tied to a standard reference atmosphere, so you need to know whether a value was derived at operating conditions or translated back to standard conditions. In compressed air work, that detail is often the difference between a sizing number that predicts behaviour and a number that merely looks tidy on paper.
A sizing workflow that keeps the number honest
When I size a component, I start with the medium, then the regime, and only then the coefficient. That sequence prevents most of the bad assumptions I see in field reviews.
- Identify whether the application is liquid, gas, steam, or a mixed or transitional service.
- Use absolute pressure wherever the ratio depends on pressure recovery or choking.
- Read the correct coefficient from the component standard or the manufacturer’s validated curve.
- Check the operating point against cavitation, flashing, and sonic-flow limits rather than assuming linear behaviour.
- Include temperature, specific gravity, and any real piping losses from reducers, bends, or long runs.
- Validate the result against live plant data after commissioning, not just against the catalogue.
The last step is the one people skip when they are under schedule pressure, and it is the one that saves the most rework. A historian trend showing upstream pressure, downstream pressure, and valve position will usually tell you more about real-world flow behaviour than a single lab number ever will. If the loop is connected to an SCADA or IIoT layer, I would use that data early, before the plant starts blaming the wrong component.
The mistakes that distort the result
Most sizing errors are not dramatic. They are small assumptions that stack up until the valve behaves badly. These are the ones I watch for first:
- Using gauge pressure in a ratio that needs absolute pressure leads to wrong choking and recovery calculations.
- Applying a liquid recovery factor to a gas system hides the point where flow becomes choked.
- Assuming line size equals valve capacity ignores the fact that the flow path, not the pipe nameplate, usually limits performance.
- Ignoring temperature changes gas density and shifts the result more than many teams expect.
- Trusting a coefficient on a regulator or check valve can be misleading because some components do not keep a stable flow coefficient in service.
- Forgetting about fittings and reducers can move the real operating point enough to change the behaviour of the whole loop.
There is also a measurement issue that people underestimate. A good coefficient is only as good as the uncertainty behind it, and that matters more in compressed gas systems where small ratio changes can flip a valve from subsonic to choked. If the test method, the calibration date, or the reference conditions are unclear, I would treat the number as indicative rather than final.
What I would log before the valve goes live
If I were commissioning a valve train or pneumatic manifold, I would not stop at the datasheet. I would log the operating picture that tells me whether the component is sitting near its limit or comfortably inside its range. That gives me a baseline for maintenance, optimisation, and fault finding later.
- Upstream absolute pressure at minimum and maximum demand
- Downstream absolute pressure at the same operating points
- Temperature at the inlet side of the component
- Valve travel, stem position, or actuator command versus actual position
- Flow rate trend, especially where demand changes quickly
- Noise, vibration, or chatter that appears during throttling
- Instrument calibration status and measurement uncertainty
That is how I treat the critical flow factor in practice: as a boundary condition that tells me where the system will stop behaving linearly, not as a shortcut that replaces proper testing. If you use it that way, you get more reliable valve selection, fewer surprises in service, and a much cleaner handoff from design to commissioning.