Choosing between equal percentage and linear control valve characteristics is really a question of how the valve will behave once it is installed in a real system. In fluid power and process control, that choice affects loop stability, controllability at low load, and how much authority the valve actually has over flow. I would treat it as a system design decision, not a catalogue preference.
The practical difference is less about theory and more about how the valve behaves in service
- Linear gives roughly the same flow change for each equal step of travel when the pressure drop across the valve stays fairly steady.
- Equal percentage gives small changes near closed position and much larger changes as the valve opens, which helps when system pressure drop shifts with flow.
- The datasheet curve is only the inherent characteristic; the real answer is the installed characteristic inside the pipework, pump, and heat load.
- Linear often fits systems where the valve owns most of the pressure drop; equal percentage usually fits systems where the rest of the circuit takes a bigger share.
- A good quick check is the valve pressure-drop decay ratio: 0.60 to 1.0 tends to suit linear, while 0.20 to 0.35 usually points to equal percentage.
- Most control valves behave best when they spend their life somewhere around 20% to 80% open, not hanging around the extremes.
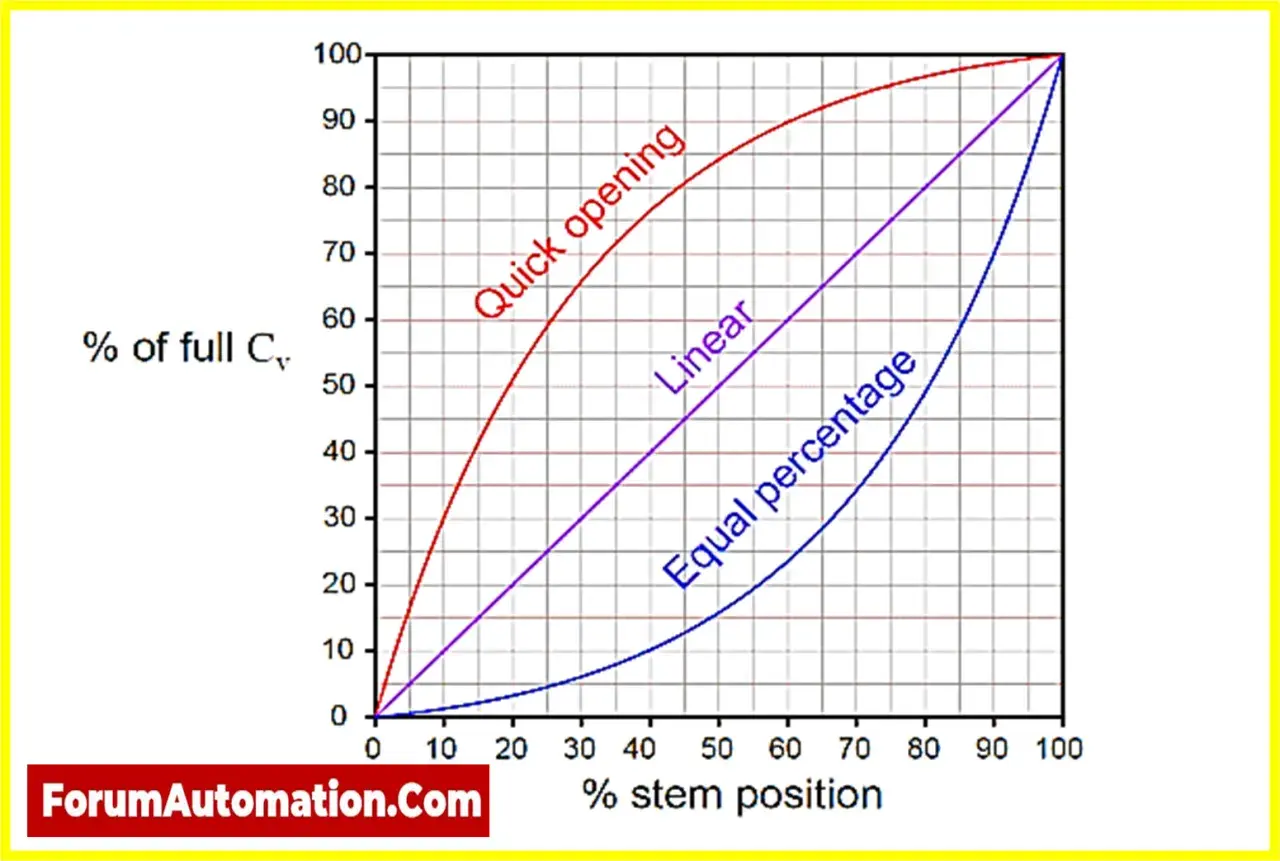
What linear and equal-percentage really mean
The cleanest way to think about the two curves is simple: linear means each equal step of valve travel produces roughly the same change in flow capacity, while equal percentage means each equal step produces the same percentage change from the current flow. That one distinction explains almost everything that follows.
On paper, linear is easy to read because the curve is straight. Equal percentage looks more curved because it starts gently and accelerates as the valve opens. In practice, I care less about the shape itself and more about what that shape does to control in the real circuit. A valve is specified in terms of Cv or Kv, but the number only matters if the installed system lets the valve use it properly.
| Characteristic | How the flow responds | Where it usually feels natural | Main risk if used in the wrong place |
|---|---|---|---|
| Linear | Equal travel gives equal flow change | Stable pressure drop, short pipework, balanced circuits | Can feel too aggressive if system pressure drop changes a lot |
| Equal percentage | Equal travel gives equal percentage change in flow | Long pipe runs, wide load swings, variable pressure drop | Can feel too soft near closed position if the system is already well balanced |
That table is the starting point, not the finish line. The next question is more important: what does the valve look like once it is installed, not just when it is tested in ideal conditions?
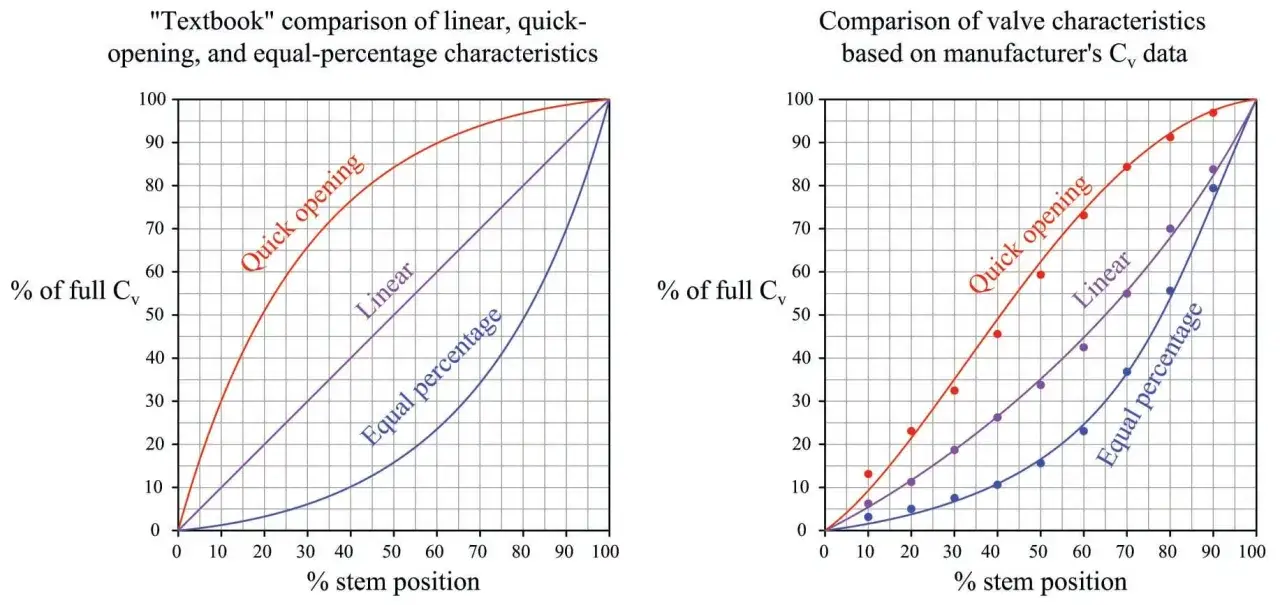
Why the installed curve matters more than the datasheet
A manufacturer’s curve is usually measured under a constant pressure drop across the valve. That is the inherent characteristic. Real systems are messier. Pipework, fittings, pumps, coils, heat exchangers, and process load all steal pressure as flow changes, so the valve’s share of the total pressure drop shifts too. That is the installed characteristic, and it is the one the operator actually feels.
This is where the decision starts to make sense. If the valve owns most of the pressure drop, a linear trim often stays nicely linear in service. If the rest of the circuit dominates, an equal-percentage trim often becomes closer to linear once installed. That is why the same valve can look “right” in one loop and awkward in another.
A useful shortcut is to look at valve pressure-drop decay, or vpdd. If the valve pressure drop at maximum flow is close to the pressure drop at minimum flow, the ratio is high and linear usually fits well. If the pressure drop falls sharply as flow rises, the ratio is low and equal percentage tends to win. As a practical guide, I use this band: linear around 0.60 to 1.0, equal percentage around 0.20 to 0.35, with the middle ground often handled by a modified parabolic trim.
There is also a more modern twist. Digital positioners can reshape the response to a degree, but I still prefer to get the valve characteristic right first. Software should fine-tune the system, not rescue a bad mechanical choice.
Once you look at the installed curve, the choice stops being ideological and becomes practical, which is where the real value is. From there, the next step is to match each characteristic to the kind of circuit you are actually controlling.
When I would choose a linear trim
I reach for linear when the valve sits in a system where pressure conditions stay relatively stable and the valve carries a meaningful share of the total pressure drop. In those cases, the valve behaves predictably, the loop is easier to tune, and the relationship between opening and flow stays close to what the controller expects.
- Balanced water circuits with a fairly steady differential pressure.
- Three-port or mixing duties where the circuit is hydraulically controlled and the valve does not see huge pressure swings.
- Applications where the valve needs a direct, proportional response rather than a shaped one.
- Loops where the flow range is moderate and the operating point spends most of its time away from the extremes.
In those environments, linear gives a tidy result because the system itself is not fighting the valve. That is a better fit than many people assume, especially in water-based fluid power systems where the pressure drop across the valve can be kept fairly consistent.
The risk comes when linear is dropped into a circuit with falling pressure drop at higher flow. Then the control action can become too strong near the bottom of the range and too weak near the top, which is exactly the opposite of what you want. If the valve is oversized as well, the problem gets worse fast. That leads naturally to the more forgiving option.
When equal percentage earns its place
I usually prefer equal percentage when the system pressure drop changes materially with flow. That is common in long pipe runs, coils, heat exchangers, steam temperature control, boiler feedwater, and many two-port water loops. In those services, the valve often loses pressure authority as flow rises, so a curved inherent characteristic helps the installed response stay usable across the range.
The reason is not mystical. Near the closed position, a gentle opening prevents the valve from becoming twitchy. Further up the stroke, the steeper part of the curve gives enough capacity to keep control alive as the circuit load changes. In other words, the trim is doing compensating work for the system.
This is also why equal percentage is often the safer starting point in wide turndown applications. If the process demand changes a lot between minimum and maximum load, the curve gives you more breathing room. You get better low-flow control without sacrificing the ability to deliver higher flow when the plant needs it.
There is one nuance worth keeping in mind. Equal percentage is not automatically “better” in every liquid service. If the valve is badly oversized, if cavitation is likely, or if the loop already has strong authority, the curve will not fix the underlying sizing mistake. It can only shape the response; it cannot make the hydraulics disappear.
A practical way to choose the right characteristic
When I am sizing or reviewing a control valve, I work through the choice in the same order every time. It keeps the discussion technical instead of instinctive.
- Estimate the pressure drop across the valve at minimum and maximum flow.
- Check whether the valve keeps a stable share of the total circuit pressure drop or whether that share decays sharply as flow rises.
- Use vpdd as a quick screening tool: high values point toward linear, low values point toward equal percentage.
- Check the likely operating band. If the valve will live mostly below 10% open, the loop will probably be unhappy regardless of trim choice.
- Make sure the valve can operate mainly between about 20% and 80% travel, where it usually behaves best.
- Review cavitation, flashing, and noise risk before finalising the trim, especially in liquids with large pressure drops.
- Only then look at whether a positioner or controller can refine the response further.
If I had to reduce that to one line, it would be this: choose the characteristic that compensates for the system, not the one that merely looks elegant on a curve chart. That logic survives commissioning far better than rule-of-thumb habits copied from another plant.
One more practical point matters in industrial automation projects. Modern digital control systems can make a poor choice look acceptable in a narrow test window, but they cannot remove the cost of bad fit at part load. If the valve is wrong for the hydraulics, you end up compensating with tuning, which is usually a less stable answer than getting the trim right at the beginning.
Mistakes that make both options look worse than they are
Most bad valve-characteristic stories start with the same handful of mistakes. None of them is subtle, which is why they keep happening.
- Oversizing the valve and then blaming the curve when control becomes touchy near closed position.
- Ignoring installed behaviour and selecting from datasheet curves alone.
- Assuming equal percentage is always the default answer, even in stable circuits where linear would be cleaner.
- Assuming linear is always simpler, even in systems where pressure drop changes dramatically with flow.
- Tuning around a bad match instead of fixing the characteristic, authority, or sizing.
- Forgetting the operating band and letting the valve spend most of its life at the extremes.
The last point is the one I see most often in the field. A valve that looks fine at full design load can still behave badly for the 80% of the year when the plant is actually at part load. That is exactly where equal percentage often helps, because it preserves useful control when the system is far from design conditions.
There is also a common misconception that the valve body type alone determines the answer. It does not. Body, trim, actuator, positioner, and system hydraulics all matter, but the characteristic is the part that shapes the feel of the loop. Once that is understood, the choice becomes much easier to defend in a design review.
The rule I trust after commissioning
After years of looking at modulating loops, my rule is still simple. If the valve owns most of the pressure drop and the circuit is steady, linear is usually the cleanest fit. If the circuit pressure drop shifts with load, equal percentage usually gives the smoother installed response. That is the practical heart of the comparison.
For fluid power applications, I would use that rule together with one final check: will the valve spend most of its life in a controllable mid-stroke region, or will it hover near shut or wide open? If it is the latter, the issue is usually not the curve alone. It is sizing, authority, or system layout.
That is why the best valve choice is rarely the flashiest one. It is the one that makes the system behave like a stable, controllable machine instead of a collection of pressure losses. If you keep that in view, the linear-versus-equal-percentage decision becomes far less mysterious and a lot more reliable.