Pressure difference is one of the most useful numbers in a hydraulic circuit because it tells you where energy is being lost, throttled, or used to do work. In this guide, I show how to find delta p in a fluid power system, which measuring method makes sense, and how to read the result without confusing a real restriction with a setup problem. The goal is practical: a reading you can trust, not just a number on a gauge.
The quickest path to a trustworthy delta p reading
- Measure upstream and downstream pressure under the same operating condition, then subtract the two values.
- Use a differential instrument when you want a direct reading; use two gauges only for simple, steady checks.
- Correct for elevation if the taps are not level, because hydrostatic head can mimic a pressure loss.
- Compare the result with a baseline or a component curve, especially on filters, valves, and coolers.
- A rising delta p usually points to restriction, contamination, or viscosity change rather than a failing pump.
What delta p means in a fluid power circuit
In fluid power, delta p is simply the pressure at point 1 minus the pressure at point 2. If point 1 is upstream of a filter, valve, cooler, or hose, then the difference tells you how much pressure that component is consuming. A small delta p is normal across free pipework, but a rising one across the same part is often the first clue that something has changed inside the circuit.
I treat the sign with care. Some transmitters report the high side minus the low side, others let you reverse the display, and a negative result may just mean the ports were connected in the opposite order. For troubleshooting, the magnitude and the location matter more than the sign, as long as you keep the convention consistent.
That is also why differential pressure is so useful in condition monitoring, it turns a vague complaint about performance into a specific comparison between two points. Once that is clear, the next step is choosing the right way to measure it.
The fastest ways to measure it at the machine
The practical answer is usually one of three methods: subtract two pressure readings, use a differential instrument with high and low ports, or infer the drop from a calibrated test point. The right choice depends on whether the circuit is steady, pulsating, portable, or already instrumented.
| Method | Best use | Strengths | Trade-offs |
|---|---|---|---|
| Two gauges and subtraction | Quick checks on simple circuits | Cheap, familiar, easy to set up | Error accumulates if the gauges are poor, and pulsation makes the result messy |
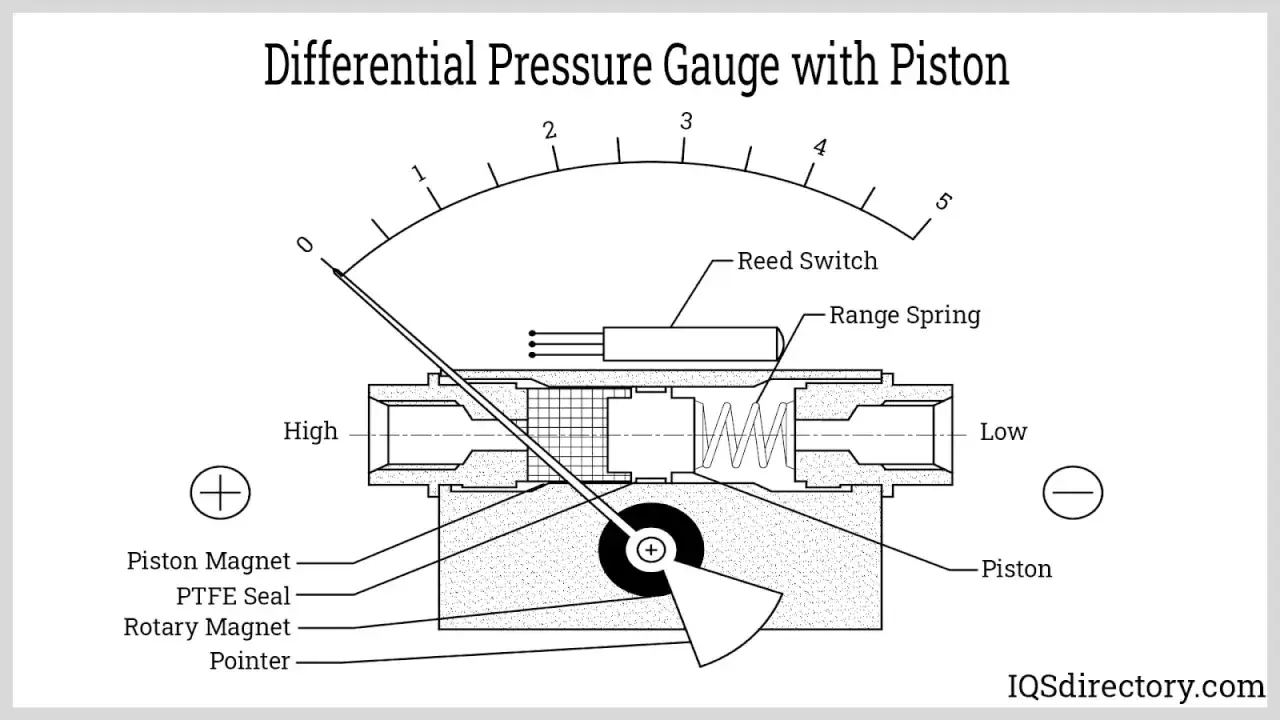
| Differential pressure gauge or transmitter | Filters, coolers, valves, and fixed installations | Direct reading, better for logging and alarms, fewer manual mistakes | Needs the right range and a cleaner installation |
| Portable manometer or test kit | Commissioning and troubleshooting | Flexible, easy to move between test points, good for field confirmation | Slower than a built-in transmitter and less happy in violent pulsation |
For a one-off check, two good gauges can be enough. For logging, alarms, or repeat inspections, I prefer a differential transmitter because it removes a lot of human error. Differential pressure transducers are built exactly for this job, they read the difference directly through high and low ports, which is what you want on a filter or a control element.
If the circuit pulses hard, I use damping, a more stable test point, or a device with averaging rather than forcing a raw reading. That is where measurement starts to become calculation, especially if the taps are not level.
How to calculate it from pressures, elevation, and flow
The core calculation is simple: delta p = p1 - p2. In UK units, I usually keep the raw reading in bar or kPa, because 1 bar equals 100 kPa and the mental conversion is quick. Where the taps are at different heights, you also need to account for hydrostatic head, which is the pressure created by the weight of the fluid column.
- Level taps: delta p = upstream pressure minus downstream pressure.
- Different elevations: add or subtract the hydrostatic term, roughly density x gravity x height difference.
- Liquid systems: 1 m of water head is about 9.8 kPa, so a 2 m level difference is about 19.6 kPa, or 0.196 bar.
That head correction matters more than people expect. If the two ports are mounted on different levels, a zero-flow circuit can still show a pressure difference, and that number may be perfectly normal. In gas systems the correction is often smaller, but in long vertical runs or vessels it still matters.
Once flow is involved, compare the corrected value with the component curve at the actual flow and fluid temperature. Parker's hydraulic filter data is a useful example here: several filter housings are specified with an initial pressure drop of no more than 0.5 bar, some are listed at 0.8 bar, and the curves are referenced at 30 cSt. That is a useful reminder that acceptable delta p depends on the component and that viscosity can move the reading more than many teams expect.
That calculation is only useful if the reading itself is clean, which is where most bad diagnoses start to show up.
Reading manufacturer curves without fooling yourself
Pressure-drop curves are not general truths, they are component-specific guides. I use them as a baseline, not as a substitute for thinking. A curve only means something if the flow, fluid, and temperature match the conditions under which it was published.
- Use the actual flow, not the nominal flow printed on the machine sheet.
- Match the reference viscosity if the chart gives one, because colder oil can push delta p up fast.
- Check whether the curve is for the housing only or for the housing plus element.
- Treat the curve as a trend reference, not as a universal pass-fail line.
This is where a filter example is especially helpful. If a filter curve is based on 30 cSt oil, then warmer oil will usually show a lower pressure drop and colder oil a higher one, even if the element is healthy. I have seen teams replace the wrong filter simply because they compared a cold-start reading with a warm baseline from another day.
Once you understand the curve, the next challenge is avoiding the setup errors that make a healthy circuit look guilty.
The mistakes that distort the reading
Most bad delta p readings do not come from the component, they come from the measurement setup. That is good news, because setup errors are usually easier to fix than pumps, valves, or actuators.
- Ports reversed, which gives you the right number with the wrong sign.
- Air trapped in impulse lines, hoses, or test kits, which makes the reading slow and unstable.
- Measuring before the system has reached steady flow and temperature.
- Ignoring elevation difference, which adds a hidden hydrostatic offset.
- Comparing readings taken at different flows, especially on throttling valves and filters.
- Mixing units, or rounding too early when the difference is small.
- Using a transmitter range that is far too wide, which hides useful detail in the low end.
Pulsation deserves special mention. In hydraulic circuits, especially around pumps and directional valves, the reading can jump around even when the component is fine. In those cases I prefer a damped transmitter, a steadier take-off point, or a short average over several readings rather than a single noisy snapshot.
Once the reading is trustworthy, the real value is knowing what it means for the machine.
What a healthy and a worrying delta p look like
A good delta p reading is not just a number, it is a pattern. I care just as much about whether the value is stable, drifting, or tied to a change in flow. That is usually more useful than staring at one isolated number.
| Component | Healthy pattern | Worrying pattern | What I check first |
|---|---|---|---|
| Filter element | Low and stable at clean baseline | Rising trend from the baseline or a sudden jump | Contamination, bypass valve behaviour, viscosity, collapsed element |
| Control valve or orifice | Pressure drop rises in line with flow | High drop at the same flow | Blockage, spool position, wear, incorrect adjustment |
| Cooler or heat exchanger | Within the expected curve at operating flow | Higher than usual at the same flow | Fouling, low flow, blocked air side, sludge on the fluid side |
| Pipe, hose, or fitting | Small and fairly stable loss | Sudden spike or noisy variation | Kink, crushed hose, partial blockage, loose fitting |
For filters, the clean baseline matters. If a design sheet shows an initial pressure drop around 0.5 bar, that is not a universal red line, but it is a useful benchmark for that specific part. If the same filter keeps climbing well beyond its starting point, I stop thinking about the gauge and start thinking about contamination, flow, and viscosity.
If delta p is high but the machine still moves normally, I suspect a restriction or a loading change before I suspect immediate pump failure. That is why the final step is to make the measurement repeatable, so the result stands up outside one test window.
A field workflow that keeps the result honest
- Define the two test points clearly and mark the high side and low side before you connect anything.
- Confirm the operating state, including flow, load, and oil temperature.
- Choose a measurement range that fits the expected drop, not a default range that is too wide.
- Purge air, zero the device, and keep the lines as short and tidy as the installation allows.
- Record the raw reading, the unit, the fluid condition, and any elevation difference.
- Compare the value with a machine baseline or a component curve, not with memory.
- Repeat the check under a second load if the first result looks borderline.
If the machine is already connected to a PLC, historian, or condition-monitoring platform, I save the trend instead of relying on a single spot check. One reading tells you what is happening now; a trend tells you whether the restriction is growing, stable, or tied to start-up conditions.
That turns a pressure check into a real maintenance tool, which is the point of measuring it in the first place.
What I check next when the number is off
- High delta p plus low flow usually points to blockage, a clogged filter, a mis-set valve, or a kinked line.
- High delta p only when the oil is cold usually points to viscosity, not a failed component.
- Normal delta p but poor machine performance usually shifts the search toward leakage, pump wear, or relief valve issues elsewhere in the circuit.
- Noisy or unstable delta p usually points to pulsation, trapped air, or a transmitter that needs damping or a better mounting point.
A good delta p reading narrows the fault fast, but only if you measure between the right points, correct for head and operating condition, and compare the result with a real baseline. In a modern fluid power plant, that is often enough to decide whether you need a clean, an adjustment, or a deeper investigation in the controls stack.