In fluid power, the real issue is not whether a system has flow or pressure, but how the two limit each other. A higher flow rate always has to be paid for somewhere in the circuit, and the bill usually shows up as pressure drop, heat, noise, or a bigger pump. This article breaks down the practical side of flow rate vs pressure drop: what the relationship means, why it curves the way it does, and how to use it when sizing pumps, valves, filters, hoses, and pipework.
The short version is that more flow usually demands a bigger pressure drop
- In most liquid systems, friction losses rise faster than flow, so the curve is usually non-linear.
- The operating point is set by the intersection of the pump curve and the system curve, not by the pump alone.
- Pipes, fittings, valves, filters, fluid viscosity, and temperature all shift the curve in different ways.
- Rising differential pressure is often the first warning sign of clogging, throttling, or an undersized component.
- Good sizing is about control, efficiency, and reliability, not just achieving the target flow.
Why the curve is rarely linear
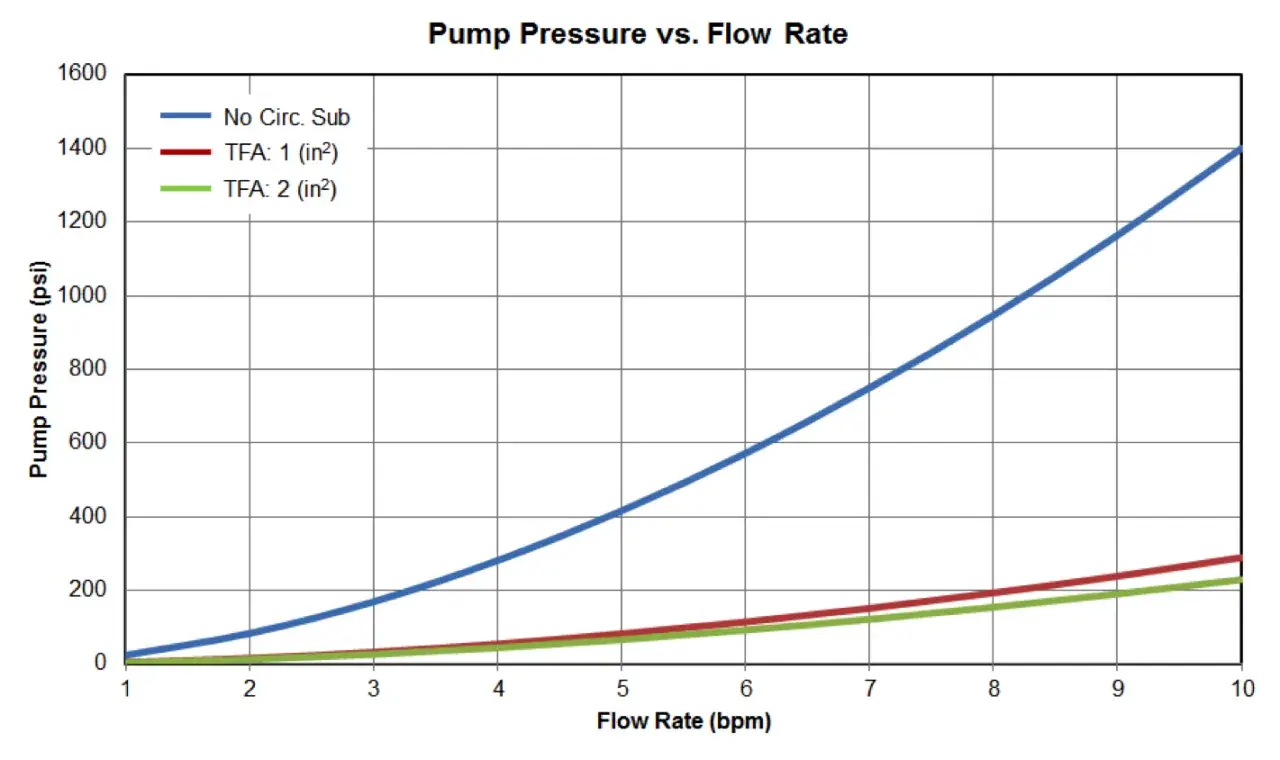
In an ideal textbook world, you might hope for a neat one-to-one trade-off: double the flow, double the pressure drop. Real pipework does not behave that politely. Once the flow is high enough for frictional effects to dominate, the pressure loss in a liquid circuit often rises with the square of the flow change. That is why a 20 per cent increase in flow can cost far more than 20 per cent more pressure.
For valves and other restrictions, I usually think in terms of Cv or Kv, the flow coefficient that links capacity to differential pressure. Cv is the imperial form and Kv is the metric form. In water service, a valve with a Kv of 16 carrying 10 m³/h sits at roughly 0.4 bar pressure drop, which is a useful reminder that the coefficient is not just catalogue decoration; it is the quickest way to see how hard a component is making the pump work.
| Flow change | Approximate pressure-drop change | What it means in practice |
|---|---|---|
| 0.5x | 0.25x | Reducing flow can free up a lot of head, but not in a straight line. |
| 1.0x | 1.0x | This is your design point and your reference for comparison. |
| 1.5x | 2.25x | A modest rise in flow can push pressure demand up sharply. |
| 2.0x | 4.0x | Doubling flow may require four times the pressure-loss allowance. |
If you want the simplest working rule, use Δp2 ≈ Δp1 × (Q2/Q1)² for many liquid circuits with turbulent flow and the same hardware setup. It is not universal, but it is good enough to show why a small flow increase can cost a lot of pressure. That square-law behaviour is the reason I do not treat pressure drop as an afterthought. It is the physics that decides whether the circuit stays stable or drifts into noise, waste, and poor control. From there, the next step is to look at the full system rather than a single component.
How the system curve sets the real operating point
A pump does not deliver an isolated flow rate; it works against a system curve. That curve describes how much pressure drop the circuit needs at each flow level, and the actual operating point is where the pump curve crosses it. In other words, the pump and the system negotiate the final result together.
One hydronic design example makes this very clear. At a design point of 30 gpm with 20 ft of head loss, the calculated system curve shows about 5 ft at 15 gpm, 8.6 ft at 20 gpm, 13.8 ft at 25 gpm, and 27.4 ft at 35 gpm. The useful lesson is not the exact numbers; it is the shape. As flow falls, head demand drops fast. As flow rises, the circuit becomes much harder to push.
That is why I trust system-curve thinking more than single-point guesses. If a pump cannot intersect the curve in the right area, the machine may still run, but it will not run well: flow may be too low, head may be too high, and energy consumption usually goes the wrong way. Once the curve is clear, the real question becomes what bends it in everyday hardware.
What actually shifts the curve in a live hydraulic circuit
Every restriction in the line adds its own signature. Some changes are obvious, such as a smaller hose or a longer run of pipe. Others hide in plain sight, such as a filter loading with dirt or a control valve working too close to shut-off.
| What changes | Effect on pressure drop | Why I care |
|---|---|---|
| Pipe or hose diameter | Smaller diameter raises velocity and friction quickly. | A slight undersize can make the whole circuit expensive to run. |
| Length and fittings | More elbows, tees, bends, and length all add loss. | Equivalent length often matters as much as straight pipe. |
| Fluid viscosity and temperature | Thicker fluid usually needs more pressure to move at the same flow. | Cold oil can make start-up losses very different from steady-state losses. |
| Filters and strainers | Clean elements have a modest drop; loaded elements can climb fast. | A rising differential pressure is often the earliest maintenance signal. |
| Valve position | More throttling increases local loss and can raise noise or cavitation risk. | Good control needs enough drop for authority, but not so much that energy is wasted. |
There is also a limit to how far you can push pressure drop before cavitation becomes a concern. When local pressure around a valve seat falls too far, vapour bubbles can form and collapse, which is when noise, vibration, and trim damage start to appear. That is why this relationship is never just a sizing exercise; it is also a reliability check. With those variables in mind, sizing becomes much less guesswork and much more diagnosis.
How I would size and troubleshoot around the numbers
When I work through a liquid circuit, I start with the design flow, then build the pressure-drop budget component by component. That means pipework, fittings, valves, filters, coils, manifolds, and any other restriction that the fluid has to pass through. Only after that do I compare the total against the pump curve or the available supply pressure.
- Set the required flow rate first, based on load, duty cycle, or actuator demand.
- Estimate each pressure loss at that flow, rather than borrowing a value from a different duty point.
- Check whether the pump or supply pressure can reach the total with a sensible margin.
- Verify that the control element still has enough authority to regulate cleanly.
- Recheck the result at part load, because many systems spend more time there than at full design flow.
| Observed condition | Likely cause | First check |
|---|---|---|
| Low flow with high pressure drop | Restriction, clogged filter, partially closed valve, undersized hose | Look for the narrowest point in the circuit and measure differential pressure across it. |
| Low flow with low pressure drop | Pump wear, low speed, air ingress, internal leakage, relief valve bypass | Check pump speed, suction conditions, and whether pressure is escaping upstream. |
| Flow drifts during operation | Temperature change, viscosity shift, dirty element, unstable control valve | Trend the data over time instead of trusting one reading. |
| Noise or vibration rises near a valve | Excessive throttling or cavitation | Compare inlet and outlet pressure, then back off the restriction. |
The practical point is simple: if you can measure both flow and pressure drop, you can separate a supply problem from a restriction problem much faster. That makes the circuit easier to tune and far easier to support in production. The traps are usually simple, which is exactly why they keep costing teams money.
Common mistakes that make the trade-off worse
The most common mistake I see is sizing only for maximum flow and forgetting what happens at part load. A circuit that looks acceptable at one point can become noisy, unstable, or expensive once the demand changes. The same logic applies in reverse: a valve that is too large may waste less pressure, but it can lose control authority and become harder to modulate accurately.
- Ignoring fluid properties at the real operating temperature.
- Using a pump margin to hide an undersized line instead of fixing the line.
- Assuming a clean filter and a dirty filter behave the same way.
- Forgetting that fittings, bends, manifolds, and quick couplers all add loss.
- Treating a lower pressure drop as automatically better, even when the control valve needs a certain amount of resistance to regulate properly.
I also think teams sometimes underplay the energy cost of throttling. If a variable-speed pump, a better valve characteristic, or a cleaner line can recover pressure loss without sacrificing control, that is usually a better answer than simply accepting extra heat. In fluid power, the cheapest pressure drop is the one you never create. That is where modern monitoring becomes genuinely useful.
What to trend before a small loss becomes a downtime event
In a smart plant, I would not wait for a failure to tell me the circuit is changing. I would trend pump discharge pressure, suction pressure, flow rate, and differential pressure across the most sensitive restriction: usually the filter, the cooler, or the control valve. A steady rise in differential pressure at the same flow is one of the clearest early warning signals you can get.
If you are working with hydraulic power units or automated process skids, the useful pattern is often a slow drift rather than a dramatic spike. That is where sensors earn their keep: they show when a circuit is becoming harder to move, when a valve is being forced to throttle more than it should, or when contamination is beginning to accumulate. Once you see the trend, you can act on it while the machine is still behaving normally.
The point I would leave with is this: flow and pressure drop are not opposing ideas, they are the same system seen from different angles. Design for the right curve, not the biggest number, and the circuit will usually be quieter, easier to control, and cheaper to run.