A torque speed curve is one of the fastest ways to see whether a motor will actually do the job, because it shows how much torque is available as speed rises, where the drive starts to run out of headroom, and where heat becomes the real limit. In motion control, that matters as much as the nameplate rating, especially when the load has to accelerate, decelerate, or hold position repeatedly. This article breaks down how to read the graph, how different motor families behave, and how I use it for sizing instead of guessing.
What you should extract from the graph first
- Continuous torque is the number that survives real duty cycles; peak torque only matters if the burst is short enough.
- The curve only means something when it is tied to the actual drive, bus voltage, current limit, and cooling method.
- Steppers, servos, and induction motors read differently, so the labels matter as much as the shape.
- Acceleration torque from inertia often decides the design, not the steady running load.
- A curve that looks generous on paper can shrink once temperature rises or the application starts regenerating.
What the graph really tells you in motion control
In motion control, I treat the curve as a map of usable operating space. It tells me where the motor can run continuously, where it can only burst for a moment, and where it will simply fall out of synchronism or overheat. The real question is not "does this motor have torque?" but "does it have the right torque at the speed my axis actually needs?"
That is why I always compare the graph with the motion profile. A conveyor, an index table, a robot axis, and a pump all stress the motor differently. Constant-load systems need a different shape than start-stop systems, and a curve that looks generous in one application can be too weak in another.
The rest of the article is about reading those differences correctly, because the shape of the line is only useful when you know what is shaping it.
How to read the graph from stall to top speed
The easiest way to read the graph is to move from left to right and ask one question at each point: what is this motor still allowed to do here? The labels matter more than the picture itself, because the same plot can mean something slightly different for a servo, a stepper, or an induction motor.
| Curve point | What it means in practice |
|---|---|
| Zero-speed torque | At or near zero speed, this may be stall torque, holding torque, or locked-rotor torque depending on the motor family. |
| Continuous torque | The torque the motor can keep delivering without thermal damage under the stated cooling conditions. |
| Peak torque | Short-duration overload torque for acceleration, breakaway, or brief disturbance rejection. |
| Base speed | The point where the motor stops behaving like a constant-torque machine and starts trading torque for more speed. |
| Pull-in zone | Stepper-specific region where the axis can start, stop, or reverse without losing synchronism. |
| Pull-out zone | Stepper-specific dynamic limit. If the load demand goes beyond it, the motor loses sync and stalls. |
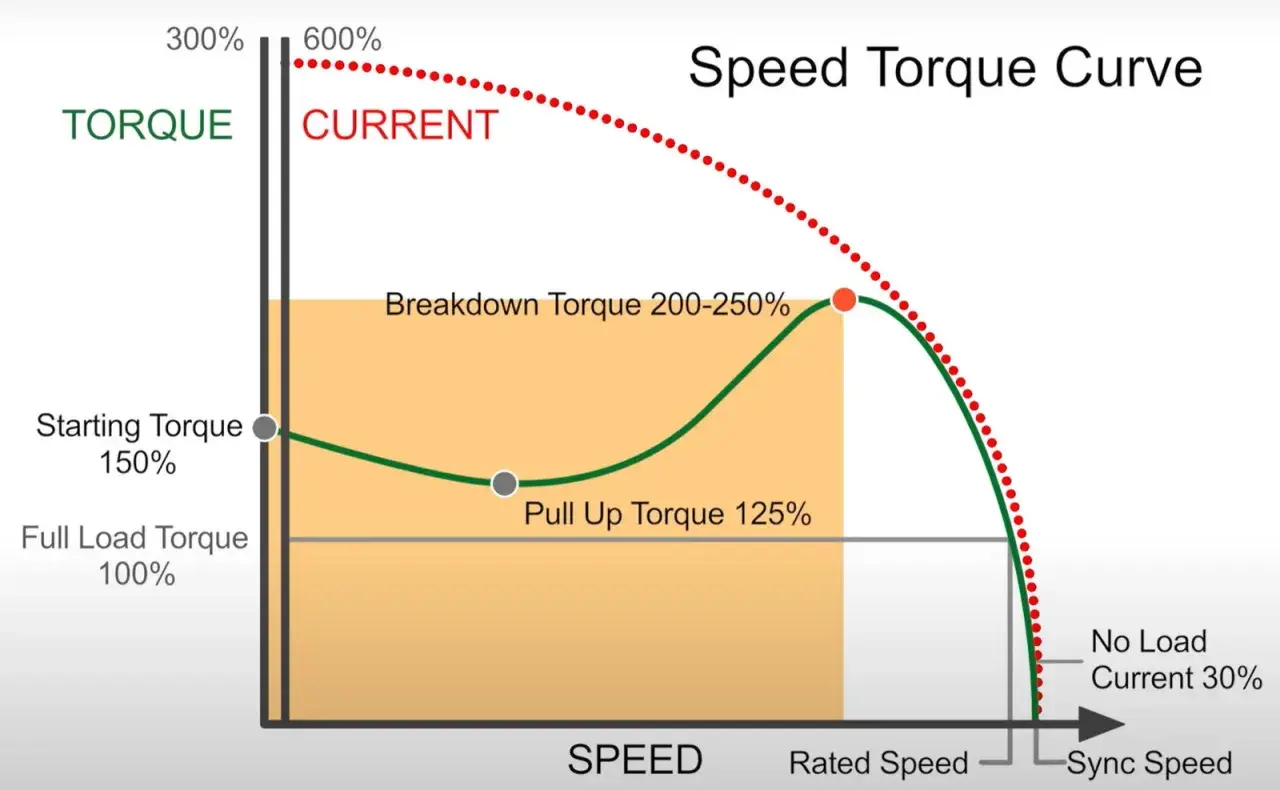
| Breakdown torque | For an induction motor, the maximum torque before slip becomes unstable and the curve drops away sharply. |
Kollmorgen points out that holding torque is a static value at rest, not the dynamic torque on the speed curve, and that pull-in and pull-out regions define whether a stepper can start and keep moving cleanly. Low-end resonance can show up around 50 to 200 steps per second, or roughly 15 to 60 rpm, which is why microstepping helps smoothness but does not solve every resonance problem.
Once the landmarks are clear, the next step is to understand why the curve shape changes from one motor and drive pairing to another.
Why the line changes with the motor, drive and cooling
The most common mistake I see is treating the curve as a fixed property of the motor body. It is not. It is a result of the motor, the drive, the supply, and the thermal path working together. Change one of those, and the usable curve can move enough to matter.
| Motor family | Typical curve shape | Main limiter | Practical takeaway |
|---|---|---|---|
| Stepper | Torque falls as speed rises, with distinct start/stop and dynamic regions. | Synchronism, resonance, and drive current. | Match the curve to the exact driver, not just the motor part number. |
| Servo or BLDC | Often close to constant torque up to base speed, then torque drops as speed increases. | Bus voltage and current limit. | Higher supply voltage usually buys more speed margin. |
| Induction motor with VFD | Constant torque below base speed, then field weakening and a constant-power region. | Slip, voltage, and thermal limit. | Expect torque to drop above nominal speed. |
| Fan-cooled motor | Can look strong at speed but much weaker near standstill. | Cooling flow at low rpm. | Do not assume rated torque is available forever at low speed. |
ABB notes that a standard induction motor's maximum torque is typically 2 to 3 times nominal torque, but drives often limit usable overload to around 70% of that in practice. Below base speed you usually live in the constant-flux range, where torque stays relatively flat; above base speed, field weakening trades torque for rpm and the curve bends toward constant power.
That is why sizing starts with the load, not with the catalogue curve.
How I size a motor against the load
When I size a motion axis, I split the job into three numbers: steady load torque, acceleration torque from inertia, and thermal torque over the duty cycle. The first two tell me whether the axis can move; the third tells me whether it can keep moving shift after shift.
Separate the steady load from the acceleration spike
For constant-torque loads such as conveyors, feeders, screw pumps, and extruders, the demand stays relatively flat with speed. For quadratic loads such as fans and centrifugal pumps, torque rises much more slowly at low speed and climbs sharply as speed increases. That difference changes the whole motor choice, because a design that is fine at one speed band can be wrong a few hundred rpm later.
Match duty cycle to thermal reality
Peak torque is cheap to claim and expensive to live with. If an axis needs 2 seconds of high torque every 10 seconds, the motor may still overheat even though the graph says the peak is available. I want the continuous point, the peak point, and the time between them to all make sense together.
Read Also: Does a VFD Change Voltage? The Full Story of Motor Control
Reflect gearbox and inertia correctly
A gearbox changes the load seen at the motor shaft, so compare reflected torque and reflected inertia with the motor-side curve, not the load-side wish list. If you skip that step, the axis often looks better on paper than it is on the machine. I also check whether the deceleration phase needs the same torque headroom as the acceleration phase, because many real machines do both.
Once those three checks are in place, the curve stops being a brochure graphic and becomes an engineering filter.
The mistakes that cost time on the machine
- Using stall or holding torque as if it were continuous - zero-speed numbers tell you something, but they do not guarantee thermal survival.
- Reading a curve without the actual drive limits - bus voltage, current ceiling, and controller settings can reshape the usable range fast.
- Ignoring temperature rise - a hot motor is a weaker motor, so the same job can work in the morning and fail later in the shift.
- Forgetting deceleration energy - if the axis is braking a heavy load, the drive or brake path has to absorb the energy somehow.
- Assuming microstepping fixes everything - it helps with smoothness, but resonance and poor sizing still show up.
- Comparing load-side numbers to motor-side numbers - reflect the mechanics first, then compare.
The rule I use is simple: if the operating point sits on the edge of the curve, it is not a comfortable design. Leave room for hot ambient conditions, supply variation, and the kind of wear that always arrives after commissioning.
That leads naturally to the final check list I use before a design leaves the bench.
What I would verify before letting a design leave the bench
- The curve was generated with the actual motor, controller, bus voltage, and cooling method.
- Continuous torque still clears the worst-case duty cycle after heat soak.
- Peak torque is available long enough for acceleration, reversal, or load disturbance.
- The deceleration path can handle regeneration without tripping the drive.
- The load stays inside the stable region of the curve across the full speed range.
- Any gearbox, belt ratio, or screw pitch has been reflected back to the motor shaft correctly.
When all of that checks out, the curve is doing its real job: it tells you the motor will not just move, but move in a way the machine can actually survive. That is the difference between a motor that looks right on paper and one that keeps an axis stable, efficient, and predictable in production.